How to Create a Professional Report Template in Microsoft Word
Creating professional and visually appealing reports is a crucial skill in today’s business world. Microsoft Word offers a comprehensive set of tools to design and customize report templates that meet your specific needs. In this guide, we will delve into the step-by-step process of creating a report template in Word, covering essential elements such as page layout, headers and footers, content organization, data visualization, and customization.
Whether you’re a student, a professional, or an entrepreneur, this guide will empower you to create impactful reports that effectively communicate your ideas and insights.
Creating a New Report Template

Creating a new report template in Microsoft Word is a simple and straightforward process. To get started, open Microsoft Word and click on “File” > “New” to create a new blank document.
Next, you can customize the page layout, margins, and font settings to your liking. To do this, click on the “Page Layout” tab and make your desired changes. You can also change the font settings by clicking on the “Font” tab.
When designing your report template, it is important to keep in mind the purpose of the report and the audience you are writing for. The template should be visually appealing and professional-looking, and it should be easy to read and understand.
Here are some tips for designing a visually appealing and professional-looking report template:
– Use a consistent font and font size throughout the report.
– Use headings and subheadings to organize the report and make it easy to read.
– Use bullet points and lists to present information in a clear and concise way.
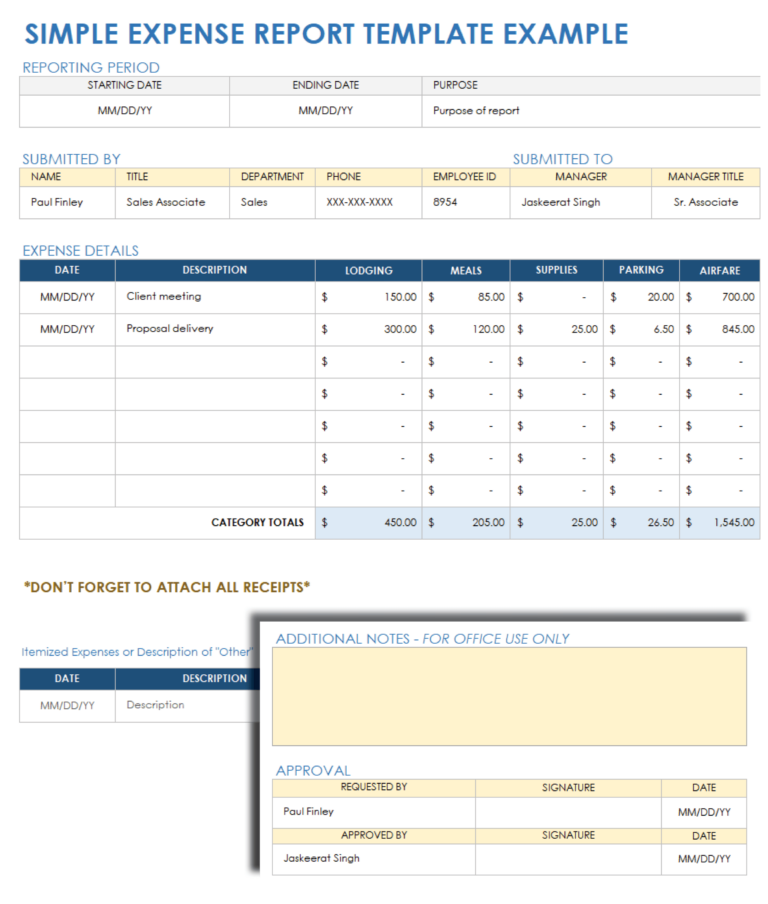
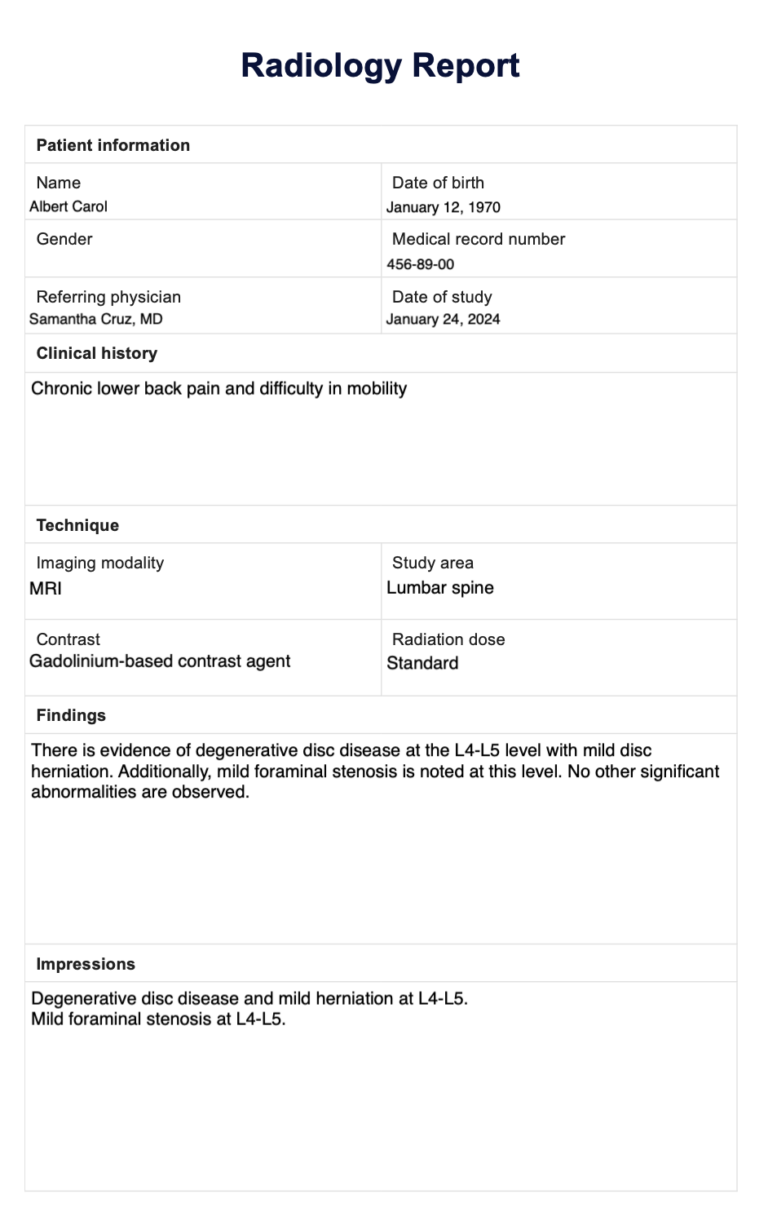
– Use tables to present data in a way that is easy to understand.
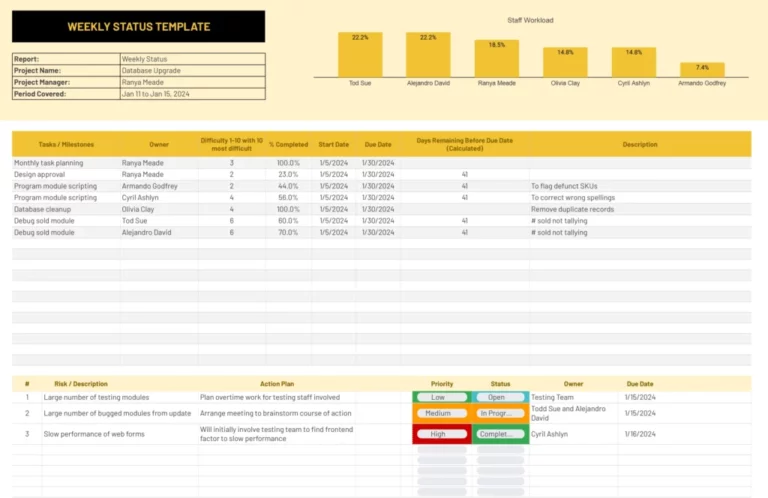
– Use charts and graphs to visualize data and make it more engaging.
– Use images and graphics to break up the text and make the report more visually appealing.
Inserting Headers and Footers
Headers and footers in a report template are crucial for providing additional information and enhancing the report’s professionalism. They can include important details such as page numbers, company logos, and contact information.
To add headers and footers, go to the “Insert” tab in Word and click on “Header & Footer.” You can choose from a variety of pre-designed templates or create your own custom headers and footers.
When customizing headers and footers, it’s important to consider consistency and professionalism. Use the same font and font size throughout the report, and make sure the headers and footers are aligned correctly.
Page Numbers
Page numbers are a common element in headers or footers. To insert page numbers, click on “Page Number” in the “Header & Footer” menu. You can choose to display the page numbers in different formats, such as “Page 1 of 5” or “1/5.”
Company Logos
Company logos can be added to headers or footers to enhance brand recognition. To insert a logo, click on “Picture” in the “Header & Footer” menu and select the logo file from your computer.
Contact Information
Contact information, such as phone numbers, email addresses, or website URLs, can be added to footers to make it easy for readers to contact the report author or organization. To insert contact information, simply type it into the footer section.
Organizing Content with Sections and Subsections

Organizing your report content using sections and subsections is like getting your room all tidy and organized. It makes it way easier to find what you need and makes your report look like a proper pro job.
Creating sections and subsections is a breeze. Just click the “Insert” tab and then “Sections”. You can then choose from a range of different section types, like “Next Page” or “Continuous”. Once you’ve created a section, you can add subsections by clicking the “Subsection” button in the “Sections” group.
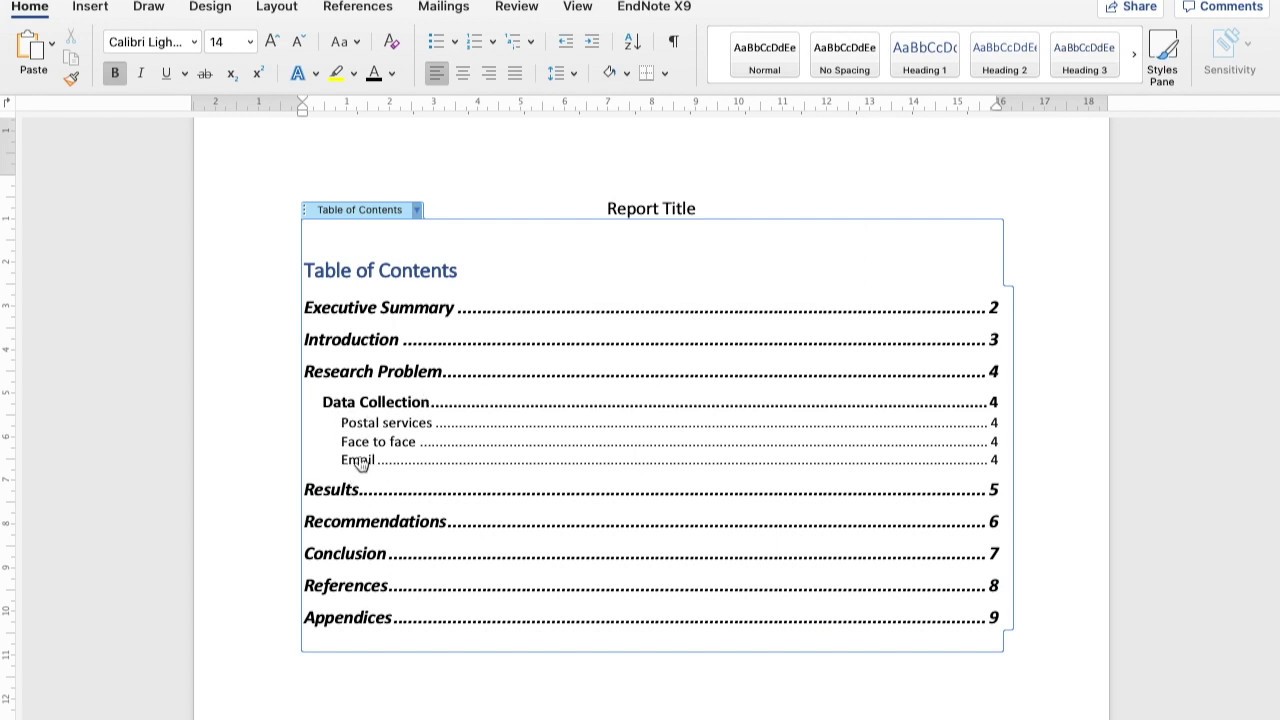
Using Headings and Subheadings
Headings and subheadings are like signposts for your report. They help readers navigate your content and understand the structure of your report. Use headings to mark the start of each section and subheadings to mark the start of each subsection.
detailed content here
Make sure your headings and subheadings are clear and descriptive. Avoid using jargon or technical terms that your readers might not understand. And keep them concise – no more than a few words.
Adding Tables and Charts
Tables and charts are powerful tools for presenting data and information in a clear and concise manner. They can help to make complex data more accessible and easier to understand.
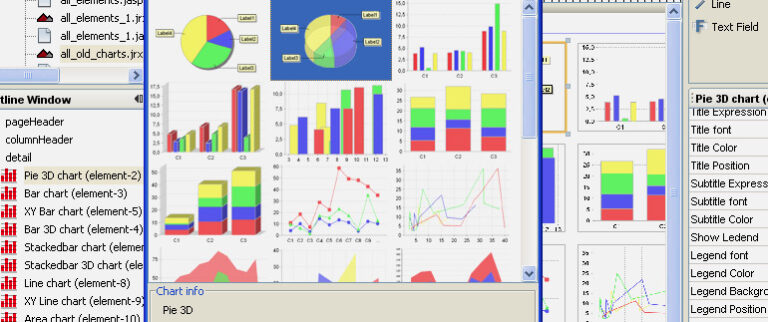
When choosing a chart type, it is important to consider the type of data you are presenting. For example, bar charts are best suited for comparing different categories, while line charts are best suited for showing trends over time.
Once you have chosen a chart type, you can customize the data visualization to make it more effective. This includes changing the colors, fonts, and labels. You can also add additional elements, such as trend lines and annotations.
By following these best practices, you can create tables and charts that are both informative and visually appealing.
Inserting and Formatting Tables
To insert a table, click on the “Insert” tab and then click on the “Table” button. You can then choose the number of rows and columns you want in your table.
Once you have inserted a table, you can format it using the “Table Tools” tab. This tab contains a variety of options for customizing the appearance of your table, including changing the border style, cell shading, and text alignment.
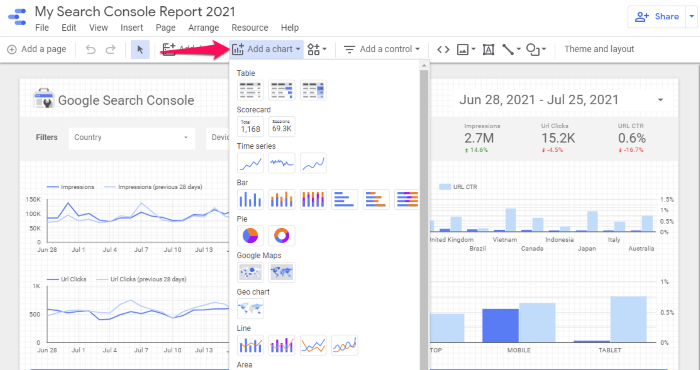
Inserting and Formatting Charts
To insert a chart, click on the “Insert” tab and then click on the “Chart” button. You can then choose the type of chart you want to create.
Once you have inserted a chart, you can format it using the “Chart Tools” tab. This tab contains a variety of options for customizing the appearance of your chart, including changing the chart type, data labels, and legend.
Inserting Images and Illustrations
Visuals play a crucial role in report presentations, making them more engaging, informative, and persuasive. Images and illustrations can break up text, clarify complex concepts, and add a touch of professionalism.
Inserting Images
To insert an image, click the “Insert” tab and select “Pictures.” Choose the image you want to include from your computer or an online source. Adjust the image size and position by dragging the handles or using the “Layout Options” menu.
Formatting Images
Use the “Picture Format” tab to enhance the appearance of your images. Adjust brightness, contrast, and saturation to make them more vibrant. Crop or resize images to fit your layout. Add borders, shadows, or other effects to give them a polished look.
Choosing High-Quality Images
Select images that are relevant, clear, and high-resolution. Avoid blurry or pixelated images. Consider the context of your report and choose images that complement the content and appeal to your audience.
Optimizing Images for Web or Print
For web presentations, compress images to reduce file size without compromising quality. Use file formats like JPEG or PNG. For print, use high-resolution images in formats like TIFF or PSD to ensure sharp and vibrant prints.
Customizing Styles and Themes
Consistency and branding are vital in report writing, and using styles and themes can greatly enhance these aspects. Styles allow for the creation of consistent formatting throughout the report, while themes provide a cohesive look and feel.
Creating custom styles is straightforward. Highlight the text you want to style, then click the “Styles” button on the Home tab. In the “Create New Style” dialog box, give the style a name and choose the desired formatting options. To apply the style, simply select the text and click the corresponding style name from the “Styles” menu.
Themes offer a quick and easy way to change the overall look of your report. Click the “Design” tab and choose a theme from the gallery. Themes include predefined color schemes, fonts, and layout options, making it easy to achieve a professional and polished look.
Choosing Fonts, Colors, and Layouts
When choosing fonts, consider the purpose and audience of the report. Serif fonts (e.g., Times New Roman) are traditional and easy to read, while sans-serif fonts (e.g., Arial) are more modern and suitable for headings and titles. Colors should be chosen carefully to avoid overwhelming the reader. Stick to a few complementary colors and use them consistently throughout the report.
The layout of the report should be clear and organized. Use headings and subheadings to break up the text and make it easier to navigate. Consider using tables and charts to present data effectively. By carefully considering these elements, you can create a report that is both visually appealing and easy to read.
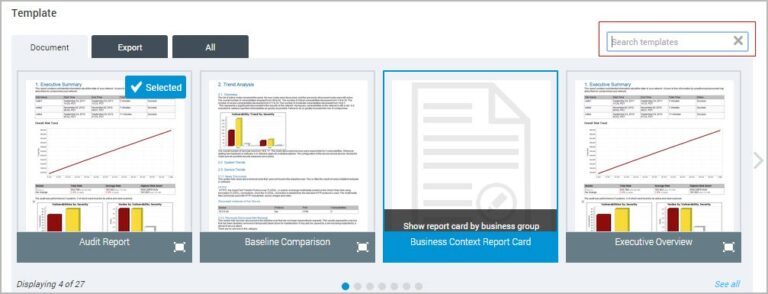
Saving and Sharing the Report Template
Once you’ve created your report template, it’s important to save it so you can use it again in the future. To do this, click on the “File” tab and then select “Save As.” In the “Save As” dialog box, navigate to the folder where you want to save the template. In the “File name” field, enter a name for the template. In the “Save as type” drop-down list, select “Word Template (*.dotx).” Click on the “Save” button.
You can also share your template with others. To do this, click on the “File” tab and then select “Share.” In the “Share” pane, click on the “Invite People” button. Enter the email addresses of the people you want to share the template with. In the “Permission Level” drop-down list, select the level of permission you want to grant. Click on the “Share” button.
It’s important to maintain the integrity of your report template. To do this, it’s a good idea to use version control. Version control allows you to track changes to the template and revert to previous versions if necessary. There are many different version control systems available, so choose one that works best for you.
Best Practices
Here are some best practices for saving and sharing report templates:
- Use a descriptive file name for your template.
- Save your template in a central location so that everyone can access it.
- Share your template with the appropriate people.
- Use version control to track changes to the template.
- Review and update your template regularly.
Helpful Answers
Can I use a report template created in Word for other purposes?
Yes, you can adapt and reuse report templates for various purposes beyond their initial use. By modifying the content and customizing the design elements, you can create templates for proposals, presentations, marketing materials, and more.
How can I ensure that my report template is accessible to all users?
To ensure accessibility, consider using accessible fonts, high-contrast colors, and descriptive alt text for images. Additionally, avoid using complex layouts or excessive graphics that may hinder readability for users with disabilities.
Is it possible to protect my report template from unauthorized changes?
Yes, you can protect your report template by saving it as a protected document. This allows you to set permissions that restrict editing, copying, or printing, ensuring the integrity of your template.